


Understanding Food Webs and Ecological Pyramids: A Guide for Students
Learn what a food web is, how energy flows through ecosystems, and the types of ecological pyramids. Explore population estimation methods with clear examples for students.
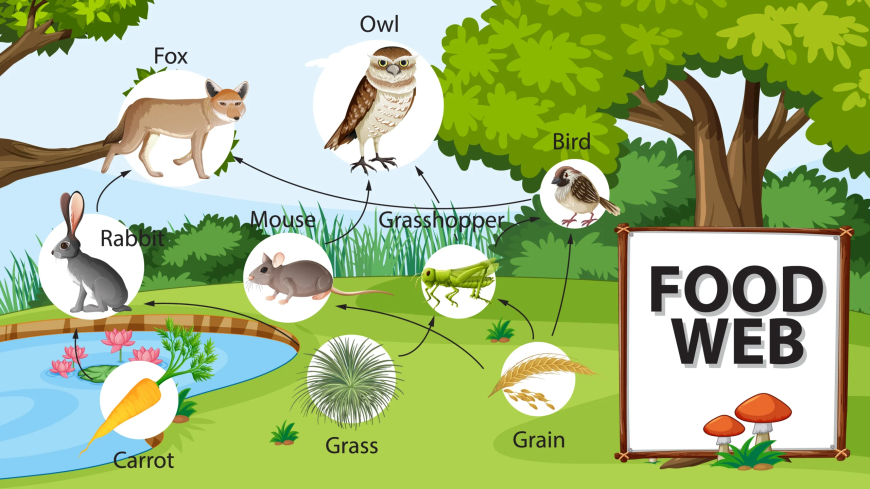
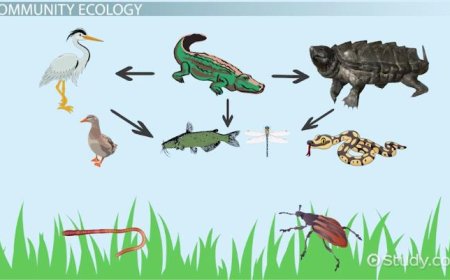
What Is a Food Web?
A food web is a network of interconnected food chains within an ecosystem. It shows how different organisms are linked through feeding relationships, with multiple paths for energy flow.
For example, from the food chains discussed in Examples 1 and 2a, a food web can be constructed by combining the various feeding relationships. This allows us to see how energy and nutrients circulate through the ecosystem in a more realistic way than a single food chain.
When drawing a food web:
-
Organisms should be grouped into trophic levels.
-
Producers (like green plants) form the base.
-
Primary consumers (herbivores) come next.
-
Secondary and tertiary consumers (carnivores) follow, occupying higher levels.
Types of Ecological Pyramids
Ecological pyramids are diagrams used to represent the number of organisms, their biomass, or energy content at each trophic level in a food chain or food web. There are three main types:
1. Pyramid of Numbers
A pyramid of numbers shows the actual number of organisms at each trophic level. The base of the pyramid represents the producers, and the width of each level indicates the number of organisms present.
Example 1:
-
40 plankton → 34 tilapia → 20 Nile perch → 4 humans
Example 2:
-
A large fruit tree might support several birds, which could be consumed by a human. The human may also carry parasites like lice.
-
This results in an inverted pyramid, as a single producer (the tree) supports many consumers.
Limitation:
The pyramid of numbers doesn't consider the size of organisms. For example, a single tree outweighs all the birds it supports, yet it appears smaller on the diagram.
2. Pyramid of Biomass
A pyramid of biomass represents the total dry mass of organisms at each trophic level. This gives a more accurate picture of energy content, as it factors in organism size.
-
Biomass decreases from producers to top consumers.
-
A single guava tree (producer) has more biomass than all the caterpillars feeding on it.
-
Caterpillars, in turn, have more biomass than the birds that eat them.
Note:
Biomass is usually measured using dry weight because water content can vary significantly between organisms.
Limitation:
Biomass can change over time as organisms grow or reproduce.
3. Pyramid of Energy
The pyramid of energy is the most accurate representation of trophic levels. It shows the actual amount of energy transferred from one level to the next.
-
Energy decreases as you move up the pyramid.
-
Plants trap light energy from the sun via photosynthesis, converting it into chemical energy.
-
This energy passes on to herbivores and then to carnivores.
Why energy is lost at each level:
-
Used in respiration
-
Lost as indigestible matter
-
Lost through death before consumption
-
Converted to other forms like heat, light, or sound
Decomposers (e.g., bacteria and fungi) also play a role by breaking down dead organisms and releasing some of the locked-in energy.
Energy Flow in an Ecosystem
Energy enters ecosystems through sunlight, which is captured by green plants. From producers, energy flows through consumers and eventually to decomposers. However, only a small portion of energy is passed on from one trophic level to the next.
This flow of energy is unidirectional and inefficient, explaining why top predators are fewer in number and why food chains rarely exceed four or five levels.
Methods of Estimating Population Size
Estimating population size is crucial for understanding ecosystem dynamics. Here are six common methods:
1. Direct Count
-
Best for large animals (e.g., elephants, buffaloes).
-
Observers walk or fly over an area and count individuals.
-
Multiple counts are averaged for accuracy.
2. Aerial Photography
-
Used for large organisms in open spaces.
-
Photographs are taken from low-flying aircraft.
-
Organisms in the images are counted and averaged.
3. Quadrat Method
-
Used for plants or stationary/small animals.
-
A square frame (1m x 1m) is randomly placed.
-
Organisms within the frame are counted.
-
The average is multiplied by the total area.
4. Line Transect Method
-
A measuring tape is laid across a habitat.
-
Organisms touching the line at set intervals are recorded.
5. Belt Transect Method
-
Similar to line transect but includes a strip (usually 1 meter wide).
-
All species within the belt are identified and counted.
6. Capture-Mark-Recapture Method
-
Best for fast-moving animals (e.g., rats, grasshoppers).
-
Capture and mark a group (n₁), then release them.
-
After some time, capture another group (n₂), including marked individuals (n₃).
-
Use this formula to estimate total population:
Where:
-
n₁ = first capture
-
n₂ = second capture
-
n₃ = recaptured marked individuals
Final Thoughts
Understanding food webs, energy flow, and population dynamics is essential for grasping how ecosystems function. Whether you're a student preparing for exams or a teacher crafting lessons, these core concepts form the foundation of ecological studies.